Building a Classifier
What is machine learning website: (https://scikit-learn.org/stable/machine_learning_map.html)
In [1]:
import pandas as pd
import numpy as np
import matplotlib.pyplot as plt
K-nearest neighbors
In [2]:
df = pd.read_csv('breastcancer_rv.csv')
df.head()
Out[2]:
| Clump Thickness | Uniformity of Cell Size | Uniformity of Cell Shape | Marginal Adhesion | Single Epithelial Cell Size | Bare Nuclei | Bland Chromatin | Normal Nucleoli | Mitoses | Class | |
|---|---|---|---|---|---|---|---|---|---|---|
| 0 | 5 | 1 | 1 | 1 | 2 | 1 | 3 | 1 | 1 | no_cancer |
| 1 | 5 | 4 | 4 | 5 | 7 | 10 | 3 | 2 | 1 | no_cancer |
| 2 | 3 | 1 | 1 | 1 | 2 | 2 | 3 | 1 | 1 | no_cancer |
| 3 | 6 | 8 | 8 | 1 | 3 | 4 | 3 | 7 | 1 | no_cancer |
| 4 | 4 | 1 | 1 | 3 | 2 | 1 | 3 | 1 | 1 | no_cancer |
Can we use classification to predict whether a cell is cancerous or not based on this data?
In [3]:
# Visualizing the data

# Creating a random jitter because many points have the same values
def make_random(a):
    return a+np.random.normal(0,0.15,len(a))

outcomes=['cancer','no_cancer']
xcol='Bland Chromatin'
ycol='Uniformity of Cell Size'
fig,ax=plt.subplots(figsize=(4,4))
colors=['m','g']
for index,outcome in enumerate(outcomes):
    truth_indices=df['Class']==outcome
    ax.scatter(make_random(df.loc[truth_indices,xcol]), make_random(df.loc[truth_indices,ycol]), 3, color=colors[index], label=outcome)
    ax.set_xlabel(xcol)
    ax.set_ylabel(ycol)
ax.legend()
Out[3]:
<matplotlib.legend.Legend at 0x26bf3169310>

Classification seems plausible with this data
Classification Approach:
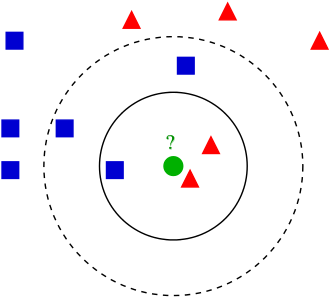
- Identify the nearest neighbors to this point:
row_distance: calculates the distance between any two points (e.g. two rows in data frame). Returns the distance.calc_distance_to_all_rows:calculates the distance from an input row to each row of dataframe. Takes two inputs: data frame and row. Callsrow_distancefind_k_closest: finds k closest rows in dataframe to input row. Callscalc_distance_to_all_rows. Returns row numbers of dataframe.plot_k_closest: For testing purposes, plots closest rows to input row, to ensurefind_k_closestis working...
- Determine the majority class and classify the point
classify: Takes a row, callsfind_k_closest, and then determines whether the majority of points is 'cancer' or 'no_cancer'. Returns 'cancer' or 'no_cancer'
- Divide the data into a random test set and training set...Determines the accuracy of classifier
evaluate_accuracy: From training set and test set, determines the percentage of test set correctly classified.
In [4]:
def row_distance(row1, row2):
    # removing class column
    row1=row1.drop('Class')
    row2=row2.drop('Class')
    # calculating distance
    dist = np.sqrt(np.sum((row1-row2)**2))
    return dist
In [5]:
def calc_distance_to_all_rows(df, testrow):
    distances=[]
    num_rows=df.shape[0]
    for row in range(num_rows):
        cr_row=df.iloc[row,:]
        cr_distance=row_distance(cr_row,testrow)
        distances.append(cr_distance)
    return distances
In [18]:
def find_k_closest(df, testrow, k, drop_closest=True):
    distances=calc_distance_to_all_rows(df, testrow)
    sorted_indices=np.argsort(distances)
    # returns indices excluding test row itself if specified
    if drop_closest:
        return sorted_indices[1:k+1]
    else:
        return sorted_indices[1:k]
In [7]:
closest_inds=find_k_closest(df, df.iloc[121,:],5)
In [8]:
def plot_k_closest(df, testrow):
    outcomes=['cancer','no_cancer']
    xcol='Bland Chromatin'
    ycol='Uniformity of Cell Size'
    fig,ax=plt.subplots(figsize=(4,4))
    colors=['m','g']
    for index,outcome in enumerate(outcomes):
        truth_indices=df['Class']==outcome
        ax.scatter(make_random(df.loc[truth_indices,xcol]), make_random(df.loc[truth_indices,ycol]), 3, color=colors[index], label=outcome)
        ax.set_xlabel(xcol)
        ax.set_ylabel(ycol)
    ax.legend()
    ax.plot(testrow[xcol], testrow[ycol], 'ro')
    ax.scatter(make_random(df.loc[closest_inds,xcol]), make_random(df.loc[closest_inds, ycol]), color='c')
plot_k_closest(df, df.iloc[121,:])

In [21]:
def classify(df, testrow, k, drop_closest=True):
    closest_inds=find_k_closest(df, testrow, k, drop_closest)
    cancer_ct=sum(df['Class'].iloc[closest_inds]=='cancer')
    nocancer_ct=sum(df['Class'].iloc[closest_inds]=='no_cancer')
    if cancer_ct >= nocancer_ct:
        return 'cancer'
    else:
        return 'no_cancer'
In [13]:
classify(df,df.iloc[88,:],17)
Out[13]:
'no_cancer'
In [ ]:
# get training and test data
num_rows=df.shape[0]
permuted_indices=np.random.permutation(np.arange(num_rows))
frac_training=0.8
training_ind=permuted_indices[0:int(0.8*num_rows)]
test_ind=permuted_indices[int(0.8*num_rows):]
training_df=df.iloc[training_ind,:]
test_df=df.iloc[test_ind,:]
In [22]:
def evaluate_accuracy(training_df, test_df, k):
    num_test_rows=test_df.shape[0]
    correct_total=0

    for rowind in range(num_test_rows):
        test_row=df.iloc[rowind,:]
        predicted_outcome=classify(training_df, test_row, k, drop_closest=False)
        if predicted_outcome==test_row['Class']:
            correct_total=correct_total+1

    return correct_total/num_test_rows
In [24]:
acc_k3=evaluate_accuracy(training_df, test_df, 3)
acc_k3
Out[24]:
0.9562043795620438